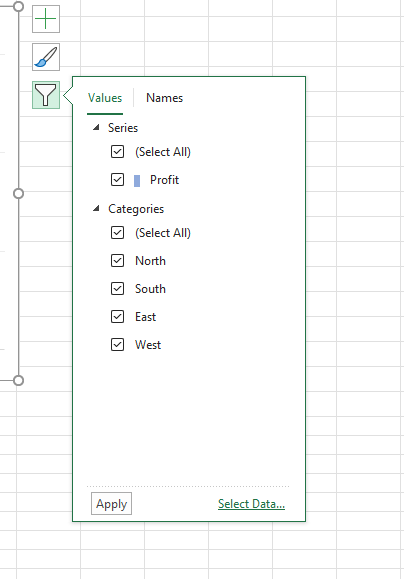
You can filter a chart, right on the chart. Select the graph and choose the filter button, the one that looks like a funnel. Choose which series or categories you want to be able to see. Select Apply.
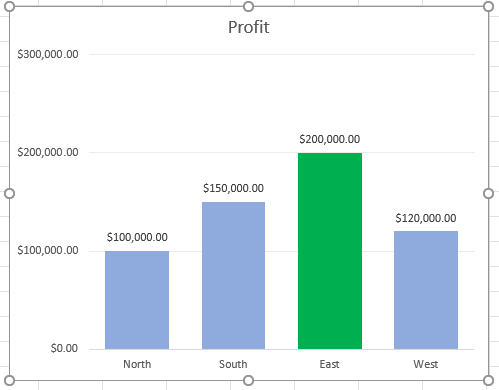
Here is the original chart.
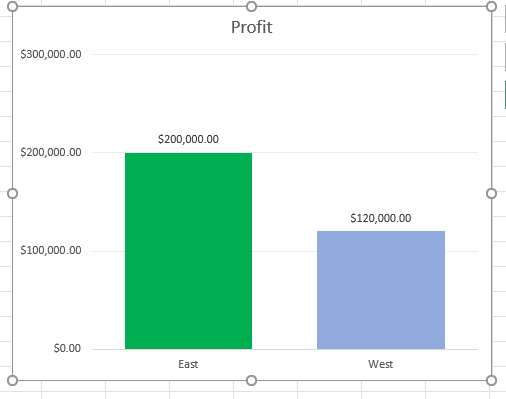
And here is the chart with North and South unselected.