If you have data that is in a table structure, i.e. column headings and rows of information then formatting your Excel data as a table has a lot of advantages.
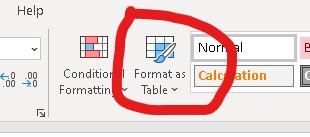
To format your data as a table, you can use the Format as Table button on the Home Menu, (Shortcut keys Alt, H, T), or Ctrl + T. This will bring up the Create Table input box. Ensure that Excel has correctly selected the data for your table (correct if need be), and tick/untick the “My table has headers” box. All tables must have headers (at least to start with). If you leave the box unticked, then Excel will add headers for you (Column 1, Column 2, etc). If you tick the box, then the first row of your data will be used as the headers.
Advantages of using Tables
Formatting
Formatting your data as a Table helps to keep your data structured properly. You automatically get a huge range of formatting options for your data, but if you don’t want this you can also easily select a Table style with no formatting. Once you click anywhere inside your Table you access the Table Design menu and can select a style of your choosing.
Other options include, turning on/off banded rows and columns, adding a total row, bolding first or last column, and removing filter buttons.
Adding a total row means you can access a range of formula without having to have any knowledge about how to write formulas! Tick the Total Row box, and new row will be added to your table. You can use the dropdown box within each cell to choose what sort of information you want displayed in this row.
Filtering
Another advantage of a table is you can add a Slicer. These have a similar functionality to filters but are displayed as a separate object and can be formatted to suit. As noted above you can turn on/off the filter buttons on the column headings using the tick box in the Table Design menu.
Tables Grow!
Lastly, tables grow as data is added to them. Once you have a table you will notice the small blue marker in the bottom right-hand corner of the “last” cell of the table (the bottom right most cell). If you type in more information in the row directly below your table, you will notice that the blue marker will move down to incorporate this new data into your table. In a similar way, if you add a new heading, or data, to the right of the current table, this new column will be included into your table.
This means that if you create a graph from the data in your table, if new data is added to the table, then the graph will grow automatically as well! Also, if you add a formula to a cell in a table then the formula is automatically filled down for the whole column. Formulas within tables, and that refer to tables are actually different from the usual Excel formulas. This might be a good topic for my next post!